

El Nino’s Demise In 2016 May Have Big U.S. Implications
By Drew Lerner
Kansas City, September 11 (World Weather Inc.) – Are you sick of hearing about El Nino and how bad it is going to be? Where is the calamity? The El Nino event is closing in on its peak of maturity – expected in the fourth calendar quarter of this year. El Nino is just now beginning to show some traditional impacts, but it took too long getting here and many crop production seasons around the world are winding down with only a small negative impact on production. For the United States, the demise of El Nino and other weather patterns anticipated for 2016 may make for a more interesting year starting with possible winter flooding in California and advancing into a wet spring in U.S. crop areas and then possibly a dry and warm to hot summer in contrast to conditions this year.
A recent article posted on the CME Group Website entitled “El Nino: Crops and Livestock Care; You Should Too!” written by Bluford Putnam and Erik Norland and published August 3, 2015 presented the below graphic about futures prices and how they relate to El Nino events. The chart suggests that the one-year change in selected commodity futures prices after the Ocean Nino Index (ONI) reaches plus or minus one can be significant for El Nino and La Nina events.
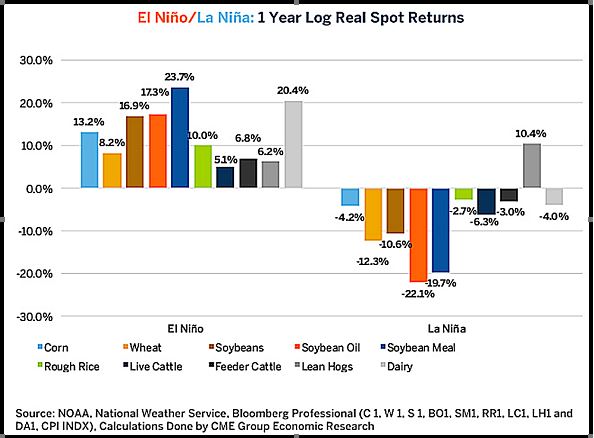
Each El Nino and La Nina event is different and the reasons for the rise and fall in commodity futures prices can differ greatly from one event to another. Clearly in this particular year commodity prices have been suppressed in recent weeks by a number of factors, but mostly due to world economics and abundant agricultural commodity stocks. With all of the hype about El Nino this year and it being the “Godzilla” of El Nino events, one would expect soaring commodity prices and extreme shortages of many agricultural products. This year has not been supporting much rise in commodity futures prices – certainly not like those shown in the above study – and one of the reasons has to be blamed on El Nino itself. Despite all of the media hype and confident weather forecasters, each El Nino event is different and this one may be one that is studied for many years to come because of its intensity and lack of calamity.
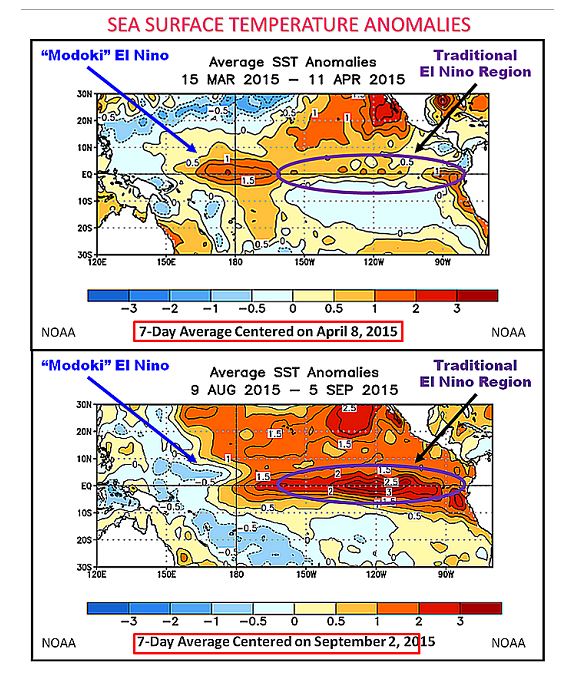
World Weather, Inc. has said from the very beginning of this El Nino event that it was going to be different and to be leery of all the hype. The reason for our stand has been due to the way this El Nino event began. Late last autumn a “Modoki” El Nino event evolved and prevailed through the first several months of this year. That event and the anomalous ocean temperatures associated with it changed the mechanics of the more traditional El Nino as it evolved from May through early September. The two events were in conflict with each other and traditional changes in world weather patterns could not follow the typical pattern of traditional El Nino events until the influence of “Modoki” was gone.
The “Modoki” influence dissipated in August and many world weather patterns have become more typical of those associated with traditional El Nino events since then. However, the three months of conflict that preceded the traditional El Nino was enough time for most of Southeast Asia’s crops and Australia crops to experience enough favorable weather to avoid the “calamitous” pattern of El Nino that so many falsely predicted.
Australia and India are now drying down and Indonesia has finally reached a critically dry phase of weather that is typical of El Nino events. Central Africa has progressively trended drier in recent weeks and each of these areas has expressed more typical El Nino impacts relative to the May through early August period.
El Nino is expected to peak in its intensity during October or November and steadily weaken from late winter into spring 2016. That will leave several months of potentially adverse weather and that may include more serious dryness in Indonesia, developing dryness in Malaysia, ongoing dryness in central Africa, developing drought in South Africa and developing dryness in east-central and northeastern Australia.
The recent return of wetter than usual weather in Brazil and ongoing dryness in western Argentina is a byproduct of the increasing influence of this year’s traditional El Nino coming on stronger week by week. The wet bias in southern Brazil should prevail for the next few months and so will the developing dryness in South Africa, eastern Australia and eventually in New Zealand. Central America and Mexico will be last to feel the increasing impact of El Nino, but will do so in the next few weeks, but until then timely rains will continue in those areas.
The changing world weather will eventually lend some support to the above chart showing the rising commodity prices during the year that follows the start of El Nino. Some would suggest that the potential for commodity prices to go much lower is low and that a turnaround in prices is bound to happen. Perhaps a part of the that turnaround will come from oil palm, sugarcane, coffee and cocoa production areas in Indonesia and Africa that are destined for more dryness issues and perhaps another problem may evolve in North America during the summer of 2016 as El Nino goes away.
Quite often the more powerful El Nino events are often followed by significant La Nina events and for the United States such a potential often brings with it a shortage of crop moisture and in some cases drought. A U.S. dryness problem in summer 2016 would certainly help to pump up commodity futures prices for grains and oilseeds. The potential for all of this is quite real and it may not be all about El Nino, but more about the transitional from El Nino to La Nina and other prevailing weather patterns.
NORTH AMERICA
This year’s El Nino will last through the Northern Hemisphere’s late autumn and winter seasons. Now that the influence of “Modoki” has dissipated the more traditional aspects of strong El Nino events will be seen through the next two seasons. For Canada and the United States, the influence from El Nino will become more notable at the end of October and more likely in November and December.
For Canada, the bias will be ever increasing warmth in the western half of the nation during the last part of this calendar year. The warming trend will eventually (during winter) spread east into Ontario and Quebec while reaching down into the northern U.S. Plains, the northern Midwest and eventually (late winter) in the northeastern United States. The warmer bias in Canada will also come with below average snowfall and some of that may leak into northern portions of the U.S. Plains, the northern Rocky Mountain region and across a part of the Great Lakes region.
In the meantime, the southern United States should trend wetter and cooler than usual during the late autumn and especially over the winter season. Frequent storms in the southern states will bolster soil moisture greatly and may set the stage for some mid-winter to early spring flooding. California will be included in the wetter bias while West Texas may see its share of rainfall it might not be nearly as anomalously wet as crop areas to the east and west. Northern Mexico will also experience wetter mid-winter conditions.
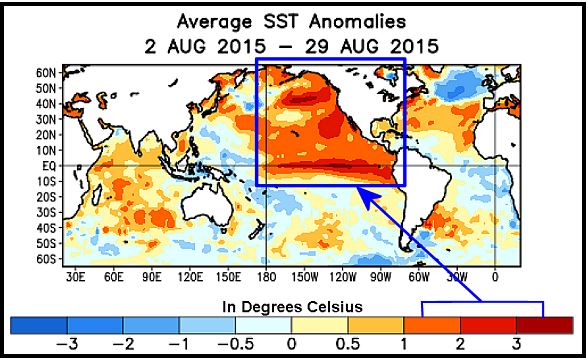
Two other weather patterns will enhance the El Nino pattern in North America. The first will be the Pacific Decadal Oscillation (PDO) that will start the autumn and continue into early winter in its strongly positive phase. Most of the eastern Pacific Ocean east of the International Dateline extending to the U.S. and Mexico coasts has notably warmer than usual water. The warm water in the eastern Pacific will prevail into winter maintaining the strongly positive PDO and that will help bring large volumes of water vapor and moisture inland from the Pacific as the jet stream shifts southward from December into February and March. These are the months that will be most active for weather across the United States and the time in which flooding rains and substantial mountain snows will impact parts of the western United States.
The storms coming into California are expected to be frequent and significant during the heart of winter resulting in flooding, mudslides and rising potentials for Sierra Nevada Avalanches. Water supply shortages in 2016 will be greatly reduced over those of this year as a byproduct of the weather scenario.
POTENTIAL LA NINA, U.S. DRYNESS
World Weather, Inc. believes the end of El Nino will come around in the spring of 2016 and there is a chance that the cooling ocean temperatures that drive the demise of El Nino at that time could be significant. Many of the strongest El Nino events on record since 1950 have ended very quickly and been followed by La Nina events. In the United States, La Nina events often bring more trouble to crop development than El Nino events. Usually, El Nino events bring moisture abundances to the United States whereas La Nina events tend to take away moisture from whatever weather pattern is prevailing at the time of evolution.
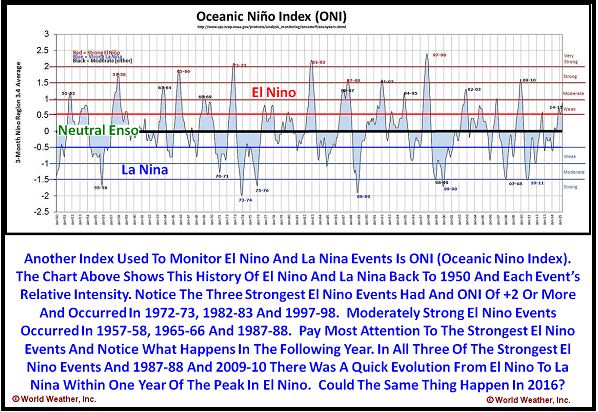
Some sample years in which strong El Nino events were followed by significant La Nina events include; 1997-98, 1982-83, 1987-88 and 1972-73. No one needs much of a reminder about the summers of 1983 and 1988 in which significant droughts impacted a part of the U.S. agricultural region. The drought of 1983 impacted a large part of the central and lower Midwest, Delta, southeastern states and southern Plains. The drought of 1988 was extensive across the Midwest and northern Plains and extended into a parts of Canada’s Prairies. The summer of 1998 was drier and warmer than usual from the southern U.S. Plains into the southeastern states while rainfall in the Midwest and northern Plains was near to above average making it one of the less threatening years for El Nino to La Nina summer seasons. The summer of 1973 was dry in the northern U.S. Plains and in a part of the northwestern Corn Belt, although there were some other areas of dryness in the Delta and southeastern states, as well, and temperatures that summer were quite warm to hot across the northern Midwest and northern Plains.
As noted previously, La Nina events take away precipitation from whatever the prevailing weather pattern is at the time. To help determine what conditions are expected to be like in 2016 we turn to the 18-year cycle which controls the upper air flow pattern. This repeating pattern can help determine rainfall biases during the coming spring and summer. The first thing we noticed in this analysis is the spring of 2016 will be wetter biased in the southeastern states and parts of the U.S. Delta and possibly drier biased in the southwestern Plains and a part of the Pacific Northwest. Spring temperatures are advertised to be warm in the north and cool in the south.
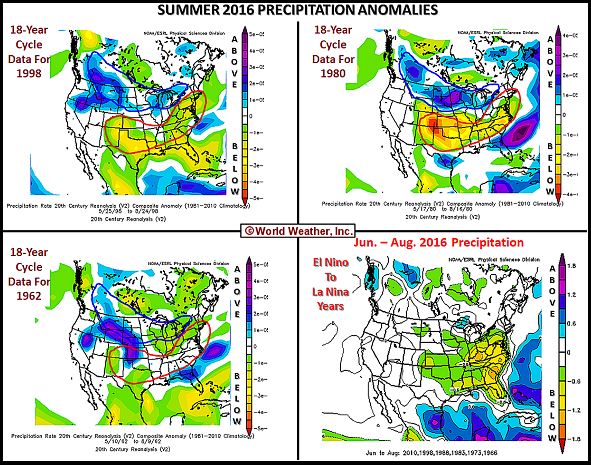
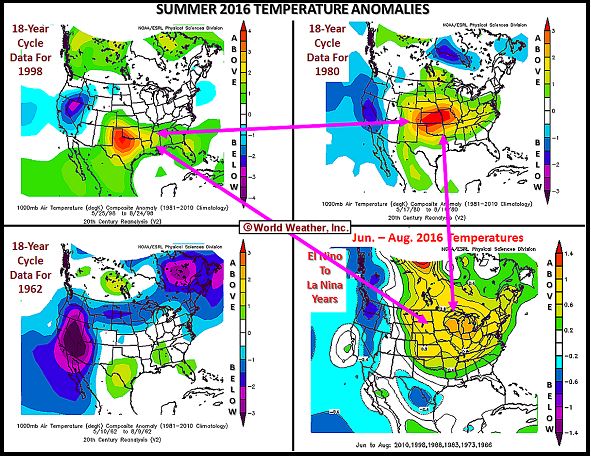
The 18-year cycle data also suggested that the summer of 2016 would possibly be warmer and drier biased in the southern Plains, Delta and southeastern states. This drier and warmer bias is of concern because the El Nino to La Nina summers tend to produce less rain from the eastern and lower Midwest through the southeastern states and into a part of the central Plains and lower Mississippi River Basin area. This is basically the same region the 18-year cycle is suggesting to be drier biased. In addition to that the El Nino to La Nina summer temperature biases tend to be warmer than usual in most of the Midwest northern and central Plains, Delta and interior southeastern states.
The conclusion to all of this suggests the spring of 2016 may be very wet in the lower Midwest, Delta and southeastern states and summer may be drier and warmer than usual. The description is somewhat similar to the drought year 1983, although there will likely be some deviations that cannot be identified quite yet. If the implications here turn out correct the balance of this El Nino event may not be nearly as important to the commodity markets as might be problems in the United States during the summer of 2016. If you are looking for a reason to drive futures markets higher the wet spring and dry summer scenario for 2016 might just prove to be the trigger needed to accomplish such a feat.
One last comment that has to be made is the scariest of all for U.S. 2016 weather and be careful not to read more into the statement that what it says. The last time that both the Ohio River Basin and the southern U.S. Plains experienced record or near record wet spring and early summers, like this year, occurred in 1935. The following year, 1936, turned out to be the second worst drought year on record following 1934. 1936 was also suspected of being a significant La Nina year.
The 2012 drought has been compared to 1934, but we have yet to see a follow up drought year and perhaps 2016 may be it. The odds of another 1936 style drought occurring is statistically quite low, but given the fact that major droughts like those of the 1930s, 1950s and 1980s rarely occurred as single events the odds favor perhaps another round of dryness. There tended to be a clustering of drought in each of the above decades and so far we have the big 2012 drought and the smaller more regional droughts in the southern states from 2010-2013. Are we through with the drought years? The odds are high that “if” a significant La Nina evolves next year there is liable to be some kind of dryness issue in the U.S. either in that summer or in 2017, but with the 18-year cycle study and 1935-36 study hanging out in the background it is hard to say that 2016 will be another fine weather year. The odds are stacked a little more persuasively toward some kind of dryness issue and the situation will need to be closely monitored.
If all of these comments turn out to be correct and verify over time, the commodity price appreciation chart displayed on page one of this report is bound to verify with the greatest commodity price appreciation occurring in the spring of 2016 when the forecasts of La Nina may begin to evolve and/or concern over a wet spring and drier summer begins to be more openly discussed.
In the meantime, some concern over delayed planting in southern Brazil this spring because of abundant rain and worry over a possible dryness issue in the late December/January period in a part of that same region might help get the ball rolling for more interest in agriculture futures trade. But long before that occurs, more chatter about oil palm production cuts from Indonesia is likely to make headlines as their drought deepens.
The bottom line is that despite all of the calamitous talk about El Nino, the biggest weather related issues may come in 2016 after El Nino has become history.
World Weather, Inc. forecasts and comments pertaining to present, past and future weather conditions included in this report constitute the corporation’s judgment as of the date of this report and are subject to change without notice. Comments regarding damage or the impact of weather on agricultural and energy as well as comments made regarding the impact of weather on the commodity and financial markets are the explicit opinions of World Weather, Inc. World Weather, Inc. cannot be held responsible for decisions made by users of the Corporation’s information in any business, trade or investment decision.
©2015 World Weather, Inc. Any unauthorized redistribution, duplication or disclosure is prohibited by law and will result in prosecution.